Benchmarking
How to benchmark Bun
Bun is designed for speed. Hot paths are extensively profiled and benchmarked. The source code for all of Bun's public benchmarks can be found in the /bench directory of the Bun repo.
Measuring time
To precisely measure time, Bun offers two runtime APIs functions:
- The Web-standard
performance.now()function Bun.nanoseconds()which is similar toperformance.now()except it returns the current time since the application started in nanoseconds. You can useperformance.timeOriginto convert this to a Unix timestamp.
Benchmarking tools
When writing your own benchmarks, it's important to choose the right tool.
- For microbenchmarks, a great general-purpose tool is
mitata. - For load testing, you must use an HTTP benchmarking tool that is at least as fast as
Bun.serve(), or your results will be skewed. Some popular Node.js-based benchmarking tools likeautocannonare not fast enough. We recommend one of the following: - For benchmarking scripts or CLI commands, we recommend
hyperfine.
Measuring memory usage
Bun has two heaps. One heap is for the JavaScript runtime and the other heap is for everything else.
JavaScript heap stats
The bun:jsc module exposes a few functions for measuring memory usage:
import { heapStats } from "bun:jsc";
console.log(heapStats());JavaScript is a garbage-collected language, not reference counted. It's normal and correct for objects to not be freed immediately in all cases, though it's not normal for objects to never be freed.
To force garbage collection to run manually:
Bun.gc(true); // synchronous
Bun.gc(false); // asynchronous
Heap snapshots let you inspect what objects are not being freed. You can use the bun:jsc module to take a heap snapshot and then view it with Safari or WebKit GTK developer tools. To generate a heap snapshot:
import { generateHeapSnapshot } from "bun";
const snapshot = generateHeapSnapshot();
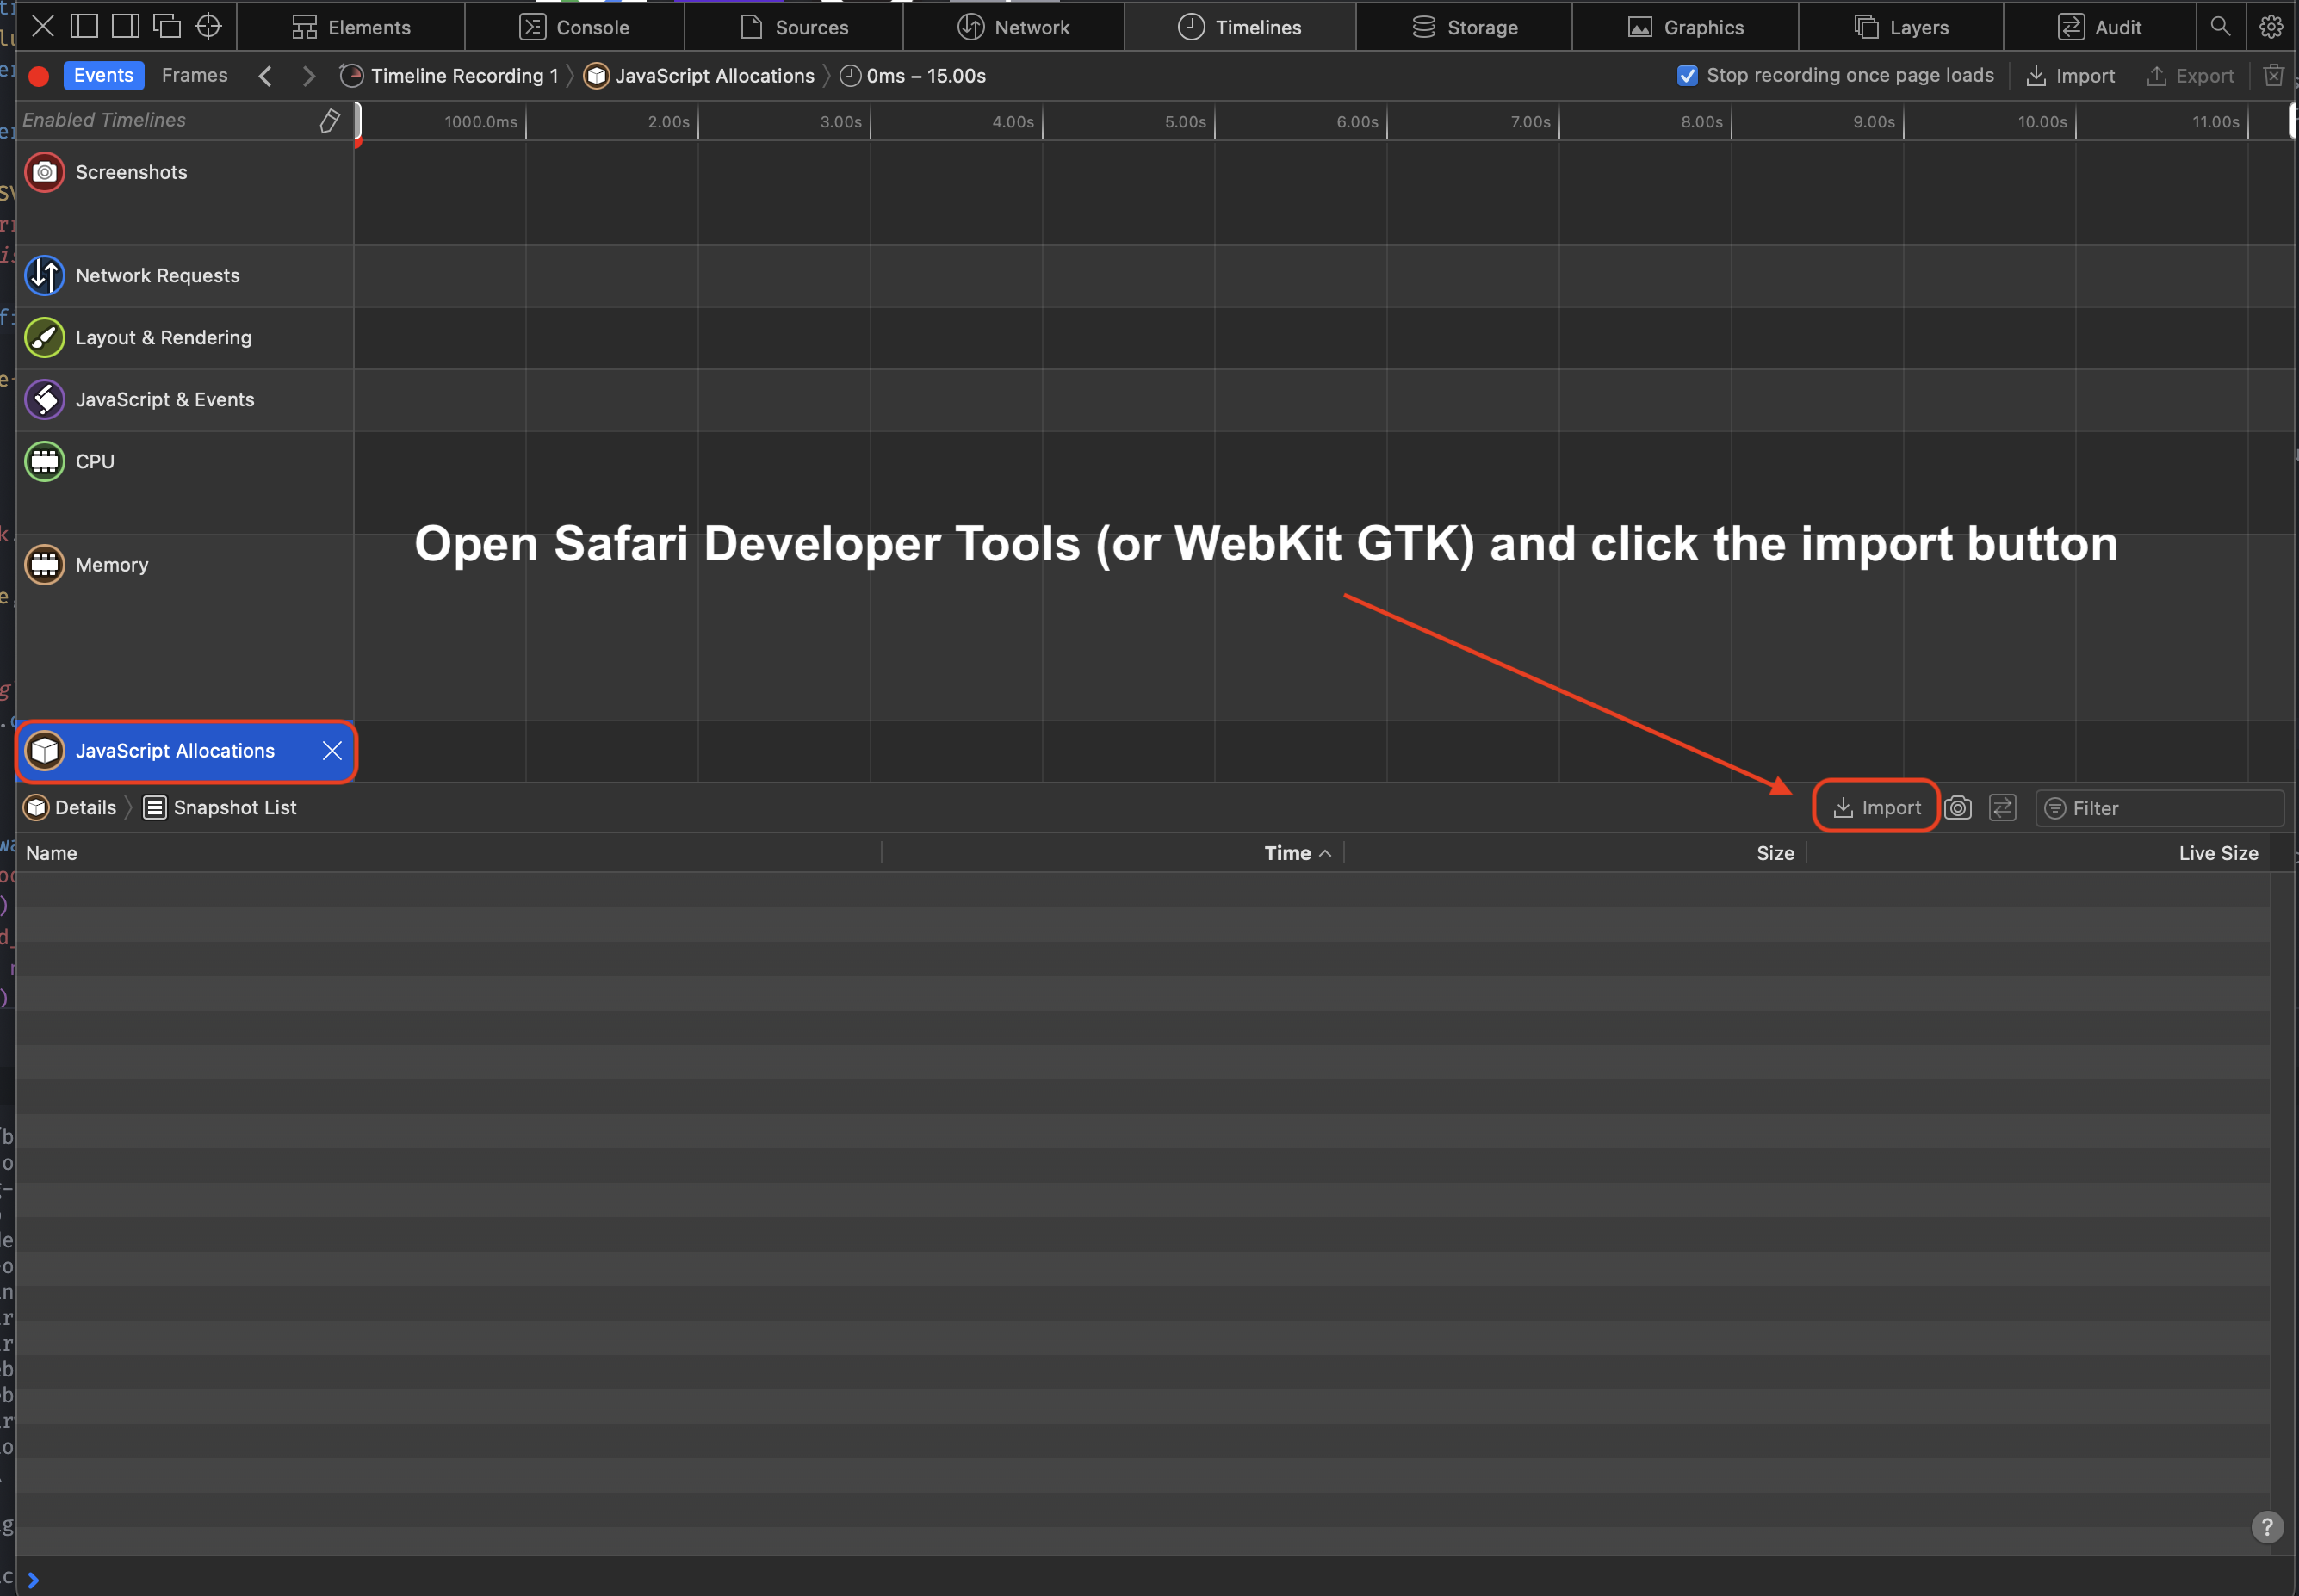
await Bun.write("heap.json", JSON.stringify(snapshot, null, 2));To view the snapshot, open the heap.json file in Safari's Developer Tools (or WebKit GTK)
- Open the Developer Tools
- Click "Timeline"
- Click "JavaScript Allocations" in the menu on the left. It might not be visible until you click the pencil icon to show all the timelines
- Click "Import" and select your heap snapshot JSON
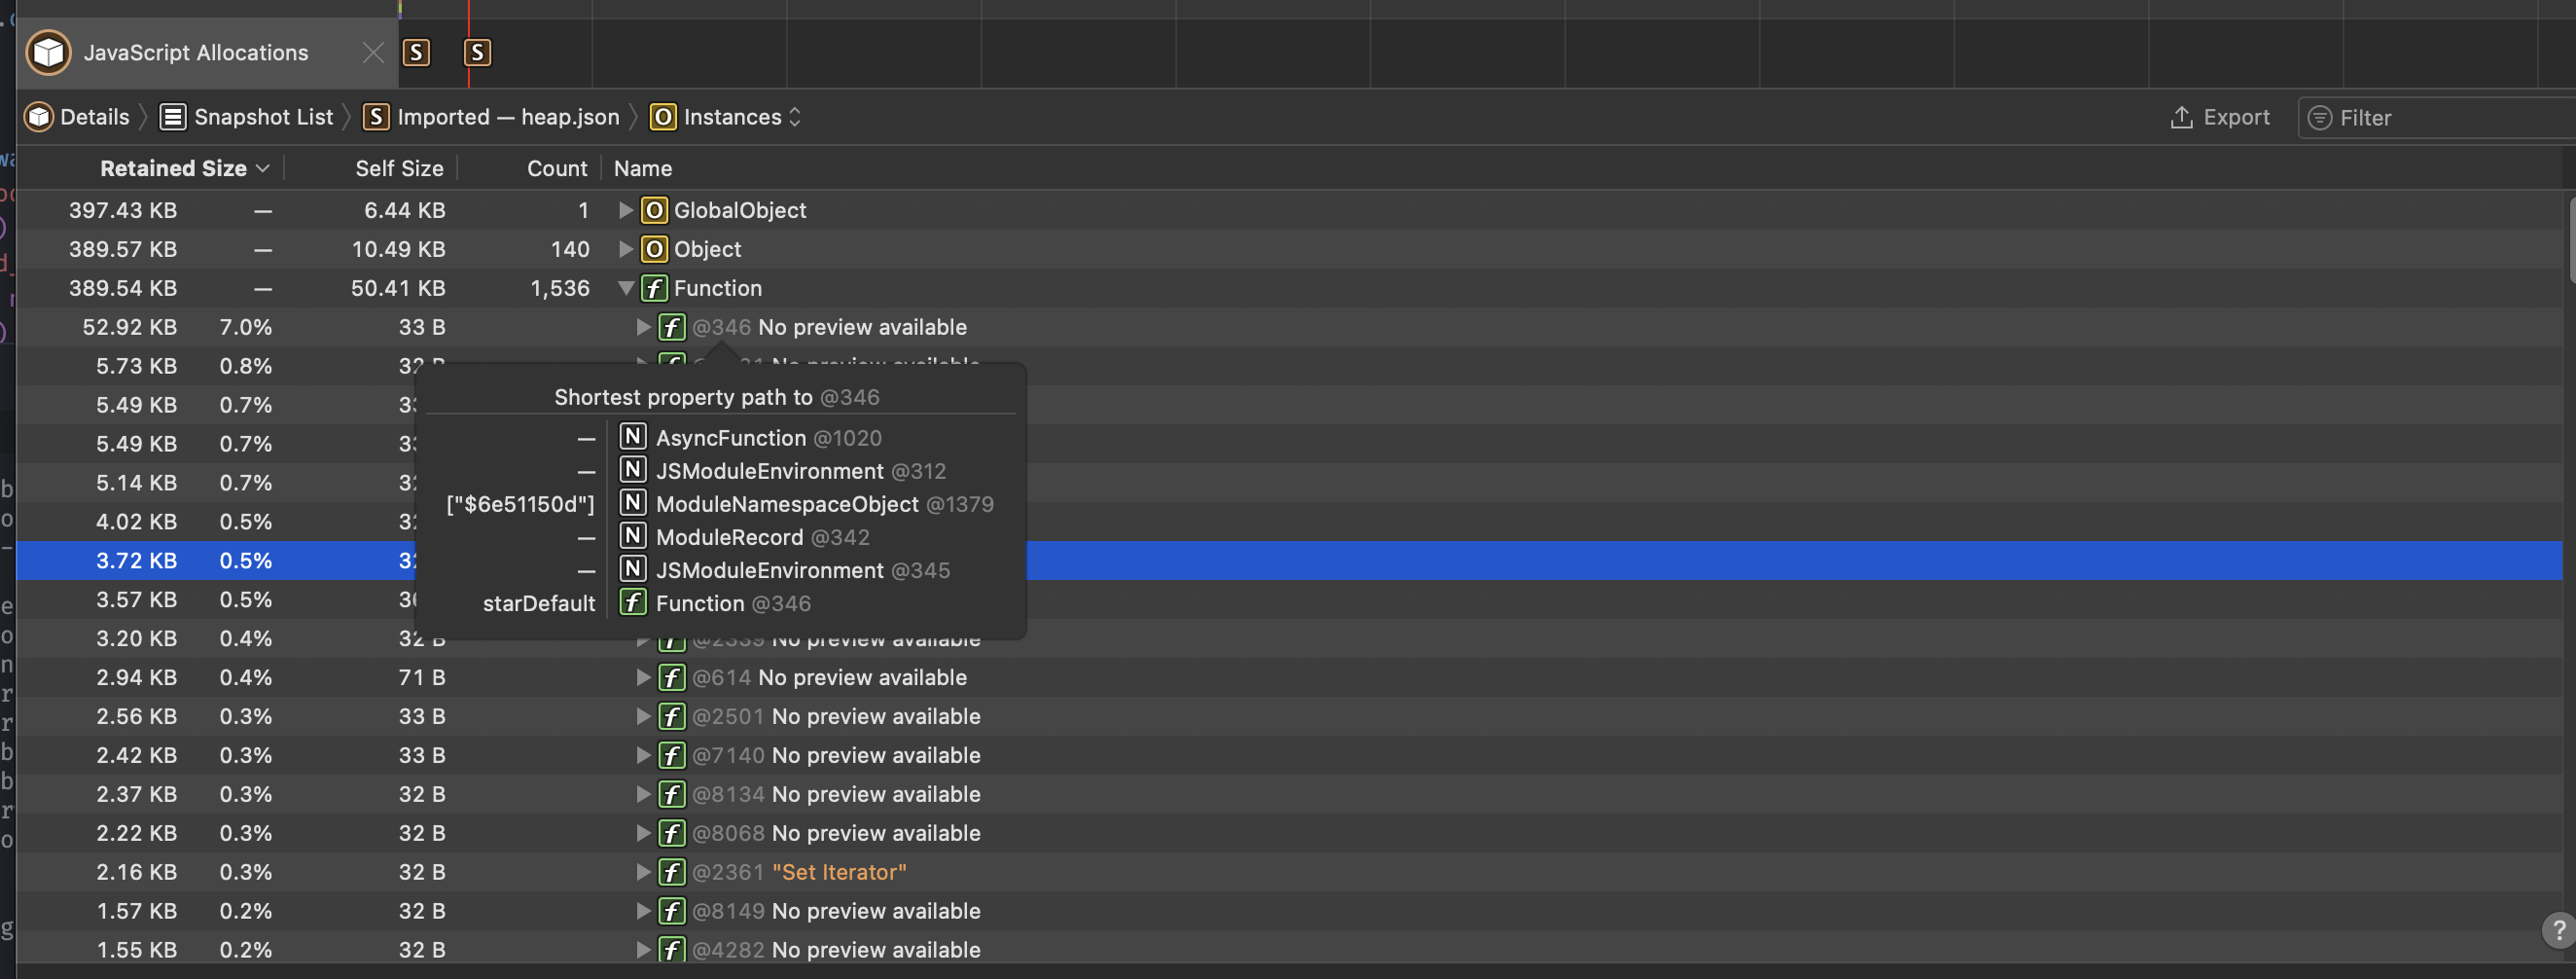
Once imported, you should see something like this:
The web debugger also offers the timeline feature which allows you to track and examine the memory usage of the running debug session.
Native heap stats
Bun uses mimalloc for the other heap. To report a summary of non-JavaScript memory usage, set the MIMALLOC_SHOW_STATS=1 environment variable. and stats will print on exit.
$ MIMALLOC_SHOW_STATS=1 bun script.js

heap stats:    peak      total      freed    current       unit      count
  reserved:   64.0 MiB   64.0 MiB      0       64.0 MiB                        not all freed!
 committed:   64.0 MiB   64.0 MiB      0       64.0 MiB                        not all freed!
     reset:      0          0          0          0                            ok
   touched:  128.5 KiB  128.5 KiB    5.4 MiB   -5.3 MiB                        ok
  segments:      1          1          0          1                            not all freed!
-abandoned:      0          0          0          0                            ok
   -cached:      0          0          0          0                            ok
     pages:      0          0         53        -53                            ok
-abandoned:      0          0          0          0                            ok
 -extended:      0
 -noretire:      0
     mmaps:      0
   commits:      0
   threads:      0          0          0          0                            ok
  searches:     0.0 avg
numa nodes:       1
   elapsed:       0.068 s
   process: user: 0.061 s, system: 0.014 s, faults: 0, rss: 57.4 MiB, commit: 64.0 MiB
CPU profiling
Profile JavaScript execution to identify performance bottlenecks with the --cpu-prof flag.
$ bun --cpu-prof script.jsThis generates a .cpuprofile file you can open in Chrome DevTools (Performance tab → Load profile) or VS Code's CPU profiler.
Markdown output
Use --cpu-prof-md to generate a markdown CPU profile, which is grep-friendly and designed for LLM analysis:
$ bun --cpu-prof-md script.jsBoth --cpu-prof and --cpu-prof-md can be used together to generate both formats at once:
$ bun --cpu-prof --cpu-prof-md script.jsYou can also trigger profiling via the BUN_OPTIONS environment variable:
$ BUN_OPTIONS="--cpu-prof-md" bun script.jsOptions
$ bun --cpu-prof --cpu-prof-name my-profile.cpuprofile script.js
$ bun --cpu-prof --cpu-prof-dir ./profiles script.js| Flag | Description |
|---|---|
--cpu-prof | Generate a .cpuprofile JSON file (Chrome DevTools format) |
--cpu-prof-md | Generate a markdown CPU profile (grep/LLM-friendly) |
--cpu-prof-name <filename> | Set output filename |
--cpu-prof-dir <dir> | Set output directory |
Heap profiling
Generate heap snapshots on exit to analyze memory usage and find memory leaks.
$ bun --heap-prof script.jsThis generates a V8 .heapsnapshot file that can be loaded in Chrome DevTools (Memory tab → Load).
Markdown output
Use --heap-prof-md to generate a markdown heap profile for CLI analysis:
$ bun --heap-prof-md script.js--heap-prof and --heap-prof-md are specified, the markdown format is used.Options
$ bun --heap-prof --heap-prof-name my-snapshot.heapsnapshot script.js
$ bun --heap-prof --heap-prof-dir ./profiles script.js| Flag | Description |
|---|---|
--heap-prof | Generate a V8 .heapsnapshot file on exit |
--heap-prof-md | Generate a markdown heap profile on exit |
--heap-prof-name <filename> | Set output filename |
--heap-prof-dir <dir> | Set output directory |